Business Agility: How the Ishikawa Diagram Unearths Opportunities for Innovation
Introduction
With technology advancing at lightning speed and customer preferences shifting unpredictably, Business Agility isn’t just a trendy term — it’s crucial for staying relevant. While Agile ways of working have been in use for decades, their primary focus has been software development rather than addressing broader organisational challenges. As many Agile leaders will agree, adopting Agile approaches doesn’t automatically lead to true agility. This is why many companies are now turning to root cause analysis tools, like the Ishikawa or Fishbone Diagram, to uncover deeper issues.
This tool, created by Japanese quality control statistician Dr. Kaoru Ishikawa in the 1960s, offers more than surface-level analysis. It delves deep into the big challenges that stop a company from being able to change and develop new ideas. Originally designed to tackle manufacturing defects, its applicability has surpassed industry boundaries. Business Agility serves as an incisive tool to diagnose bottlenecks, carve out opportunities, and propel innovative solutions. But how can it achieve this feat? This blog post shows you the ins and outs of using the Ishikawa Diagram to systematically enhance your organisation’s agile capabilities.
Step 1: Identifying the Problem
The first step in any journey towards Business Agility using the Ishikawa Diagram is pinpointing your organisation’s problem. Remember, being unclear is the enemy of making progress. A well-defined problem statement acts as a compass, providing a sense of direction to your analytical endeavours. For example, rather than stating something generic like “business isn’t doing well,” you might specify, “Our organisation is struggling to adapt to rapid market changes.”
Action Plan:
Convene a team of stakeholders, both from leadership and operational roles.
Frame the problem statement collectively, ensuring it encapsulates the core issue hindering your agility.
Write this down in a Problem Statement Table. In one column, note the current situation; in the adjacent column, define the optimal situation for your organisation.
Real-world Application:
Organisations often embark on an agile transformation without clearly understanding the obstacles. Let’s consider a financial services firm that notices a rising customer churn rate. Initially, the blame might go to superior FinTech solutions in the market. However, a deeper dive might reveal a rigid corporate culture resistant to change as the main culprit.
Innovative Ideas and Potential Solutions:
Leadership: Use machine learning to sift through company data and identify key problem areas quickly.
Culture: Establish a ‘Safe Space Forum’ where team members can freely discuss challenges.
Processes: Implement ‘Problem-Solution Fit’ workshops to align issues with business goals.
Skills: Create a ‘Skills Matrix’ to identify skill gaps related to problem-solving.
Tools: Adopt AI-powered analytics tools for data-driven problem identification.
Communication: To keep everyone informed, implement bi-weekly ‘State of the Problem’ updates.
Step 2: Constructing the Fishbone Diagram
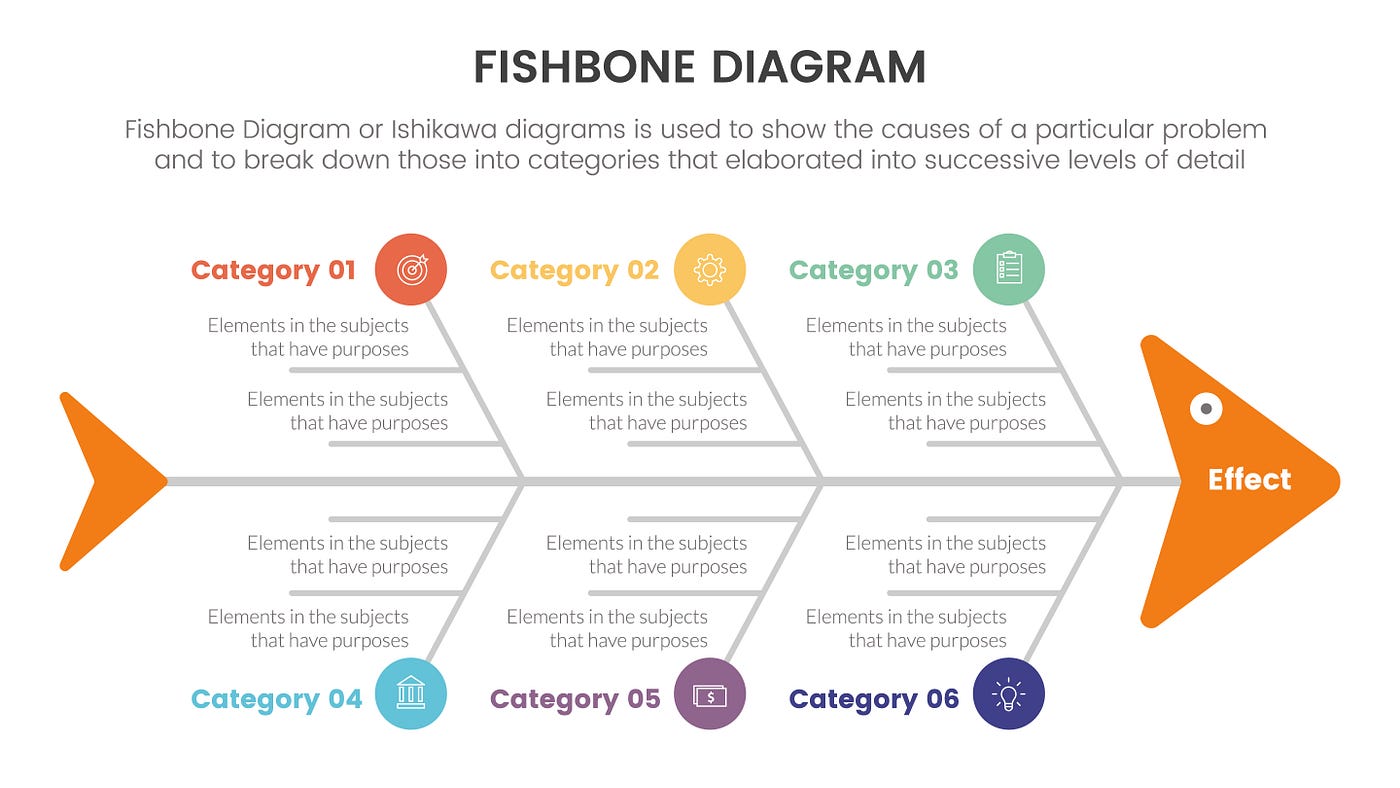
In pursuing Business Agility, it’s crucial to have a systematic methodology to dissect problems. The Fishbone Diagram helps teams work together visually, making it easier to understand your problems. Acting as a structured brainstorming tool, it assists in sorting thoughts and hypotheses into specific categories that can be studied in detail. When correctly utilised, the Fishbone Diagram transcends its appearance as a simple chart and becomes a strategic instrument in an organisation’s problem-solving arsenal.
Action Plan:
Initiate by drawing a long horizontal line across a whiteboard or a digital sketching tool to symbolise the ‘spine’ of the fish. This serves as the anchor for your problem statement.
At the extreme right end of this line, document your identified problem.
Subsequently, pinpoint 4–6 main categories that are potential vessels for the root causes of your problem. These could range from Leadership to Culture, Processes, Skills, Resources, and Communication.
Draw diagonal lines or ‘bones’ from the spine to represent these categories.
Adjacent to your diagram, prepare a table with columns labelled “Cause Categories” and “Current State.” For each category, explain how it’s presently managed in your organisation.
Real-world Application:
Consider that you are part of a financial services firm wrestling with high client attrition rates. During a brainstorming session, a Fishbone Diagram could be your go-to strategy. Categories may extend from ‘Client Services’ and ‘Product Features’ to ‘Customer Experience’ and ‘Cost Structure.’ The ultimate objective is to enumerate all plausible contributors to the dilemma under these categories.
Innovative Ideas and Potential Solutions:
Leadership: Assign a ‘Fishbone Champion’ to the leadership team to oversee its implementation.
Culture: Use ‘Idea Voting’ mechanisms for democratic selection of cause categories.
Processes: Incorporate ‘Real-time Fishbone Updating’ using digital collaboration tools.
Skills: Introduce ‘Fishbone Training Labs’ for hands-on experience in diagram construction.
Tools: Use cloud-based Ishikawa Diagram software for seamless team collaboration.
Communication: Facilitate a ‘Fishbone Communication Loop’, ensuring transparency and feedback.
Step 3: Categorising Root Causes
The key to solving problems the Agile way is often to figure out what’s getting in the way of progress. While many root cause analysis techniques exist, they tend to be unorganised and disconnected, leading to only skin-deep solutions. What sets the Fishbone Diagram apart is its systematic approach to categorisation, enabling a team to trace issues to their origin.
Action Plan:
Once you’ve drawn the primary categories as bones connected to the spine, it’s time to delve deeper.
Consider 2–4 subcategories within each primary category that could contribute to the problem. Attach these as smaller diagonal lines emanating from the primary ‘bones.’
The objective is to drill down to specifics. The more granular you get, the easier it becomes to pinpoint exact problem areas.
Use this phase as a brainstorming session. Encourage team members to contribute openly, ensuring a variety of perspectives are considered.
Real-world Application:
Imagine you are leading an Agile transformation in a manufacturing firm. Your Fishbone Diagram has a ‘Processes’ category. Subcategories might include ‘Inventory Management,’ ‘Quality Control,’ and ‘Resource Allocation.’ By zooming into these facets, you could discover that ‘Resource Allocation’ is particularly problematic due to outdated software. Thus, your focus would be tackling this sub-issue rather than revamping all ‘Processes.’
Innovative Ideas and Potential Solutions:
Leadership: Implement ‘Root Cause Analysis Sprints’ led by senior management.
Culture: Utilise gamification to make the root cause identification process engaging.
Processes: Leverage ‘Automated Root Cause Tagging’ to easily categorise issues.
Skills: Use ‘Root Cause Hackathons’ to enhance problem-solving skills.
Tools: Integrate AI algorithms for advanced root cause categorisation.
Communication: Maintain an ‘Ishikawa Communication Board’ for transparent status tracking.
Step 4: Scrutinising Root Causes for In-Depth Analysis
The Fishbone Diagram serves not just as an organisational tool but also as a discussion starter. The value it brings to the table isn’t solely in its structure; it lies in the conversation and scrutiny that it encourages. So, once you’ve found and sorted possible root causes, the next step is to examine each one closely.
Action Plan:
Begin with one category and explore each potential root cause listed. Ask questions like, “Why is this a problem?” “What are the consequences?” and “How does this affect our Agile efforts?”
Use other analytical tools like the 5 Whys or Pareto Analysis to dig deeper into each root cause.
Take notes, jot down observations, and encourage dialogue. Make it an interactive session where everyone’s opinion is valued.
Create a priority list based on the severity, impact, and ease of resolving each issue. Having delved deep into the root causes and understood their implications, it’s time to transition from analysis to prioritised action.
Real-world Application:
In an educational organisation embarking on Agile transformation, the Fishbone Diagram might expose ‘Curriculum Development’ as a subcategory under ‘Processes.’ An in-depth analysis may uncover that faculty resistance to agile methods is the root cause. By scrutinising this aspect, the organisation can focus on change management strategies specifically targeting faculty.
Innovative Ideas and Potential Solutions:
Leadership: Establish an Agile Steering Committee meeting bi-weekly to ensure leadership buy-in.
Culture: Introduce ‘Agility Scorecards’ to monitor and reward agile behaviour among team members.
Processes: Implement a ‘Sprint Zero’ dedicated solely to eradicating bureaucratic red tape.
Skills: Develop an ‘Agile Bootcamp’ offering immersive training experiences.
Tools: Use Big Data analytics to evaluate the efficiency of current agile tools.
Communication: Establish a weekly ‘Agile Newsletter’ to disseminate updates and celebrate wins.
Step 5: Prioritise and Act
Having scrutinised all the root causes and their corresponding categories, the next step is to set priorities. Not all root causes are created equal. Some problems may be bigger but also need more resources to fix. Conversely, others might have a lower impact but can be quickly addressed.
Action Plan:
Use a weighted scoring model to prioritise root causes based on impact, ease of implementation, and time required.
Develop an action plan outlining the steps to address each priority root cause.
Assign responsibilities and set deadlines for each action item.
Communicate this action plan to all stakeholders, ensuring everyone understands their role in the implementation.
Real-world Application:
In a marketing agency struggling with low employee morale, ‘Culture’ and ‘Communication’ might be the top priority categories. A weighted scoring model could reveal that improving internal communication has a high impact and low implementation cost. Therefore, this becomes a priority action item.
Innovative Ideas and Potential Solutions:
Leadership: Conduct ‘Agile Leadership Retreats’ focusing on building a culture of continuous improvement.
Culture: Launch a ‘Fail Fast, Learn Faster’ initiative to encourage experimentation.
Processes: Introduce a ‘Pull System’ in work allocation to eliminate bottlenecks.
Skills: Offer ‘Agile Fellowships’ for employees to spend time in high-performing agile organisations.
Tools: Deploy a ‘Real-time Dashboard’ displaying key performance indicators.
Communication: Create an ‘Open Mic Agile Forum’ for employees to discuss challenges and solutions openly.
Step 6: Collect Feedback and Iterate
Feedback is a cornerstone of Agile methodology, and it’s equally crucial when refining your approach to Business Agility based on the Fishbone Diagram analysis. Your action plan shouldn’t be a one-time thing; it should keep getting better.
Action Plan:
After implementing solutions, create mechanisms to collect data and feedback from stakeholders.
Regularly schedule review sessions to assess the impact of implemented changes.
Use feedback loops to continually refine and adapt your strategies for improving Business Agility.
Real-world Application:
For a financial institution that identified ‘Processes’ and ‘Skills’ as root causes hindering Business Agility, post-implementation feedback could reveal that while ‘Processes’ have improved, ‘Skills’ still need attention. This insight would guide the next iteration of the action plan.
Innovative Ideas and Potential Solutions:
Leadership: Establish ‘Agile Leadership Scorecards’ to measure leadership’s commitment and impact on agility.
Culture: Use ‘Employee Experience Surveys’ to gather data on the effectiveness of cultural initiatives.
Processes: Implement ‘Process Audit Trails’ to track efficiency gains or losses.
Skills: Create a ‘Peer Review System’ for continuous skill assessment.
Tools: Use ‘Analytics Dashboards’ to monitor tool efficiency.
Communication: Roll out ‘Feedback Boxes’ in virtual team rooms for anonymous input.
Conclusion: Harnessing the Power of the Fishbone Diagram for Business Agility
The journey to Business Agility is a complex and ongoing process requiring a strategic mindset and attention to detail. While Agile methodologies give us a broad framework for driving change, the Ishikawa or Fishbone Diagram equips us with the fine-tuned analysis needed to identify underlying issues and innovate purposefully.
This diagram isn’t just a one-time tool but a living document that should be revisited and updated as you collect more data and feedback. Following the six-step approach outlined in this blog post, you will unearth the bottlenecks and challenges that may impede your organisation’s agility and develop targeted, innovative solutions to address them.
Remember, agility is not merely about speed; it’s about pivoting and adapting effectively in an ever-changing business world. In this setting, the Fishbone Diagram becomes a helpful tool, turning tough problems into chances for real action.
Article originally published here: https://www.agiledeltaconsulting.com/post/navigating-business-agility-how-the-ishikawa-diagram-unearths-opportunities-for-innovation
Thanks so much for reading! If you enjoyed this post, please give it a clap or two so others can find it! Have a wonderful day!
Join my mailing list for expert insights and strategies on Agile and Technology Leadership, Digital Transformation, Change Management and Business Agility.
About the Author
Giles Lindsay is a technology executive, business agility coach, and CEO of Agile Delta Consulting Limited. Renowned for his award-winning expertise, Giles was recently honoured in the prestigious “World 100 CIO/CTO 2024” listing by Marlow Business School. He has a proven track record in driving digital transformation and technological leadership, adeptly scaling high-performing delivery teams across various industries, from nimble startups to leading enterprises. His roles, from CTO or CIO to visionary change agent, have always centred on defining overarching technology strategies and aligning them with organisational objectives.
Giles is a Fellow of the Chartered Management Institute (FCMI), the BCS, The Chartered Institute for IT (FBCS), and The Institution of Analysts & Programmers (FIAP). His leadership across the UK and global technology companies has consistently fostered innovation, growth, and adept stakeholder management. With a unique ability to demystify intricate technical concepts, he’s enabled better ways of working across organisations.
Giles’ commitment extends to the literary realm with his book: “Clearly Agile: A Leadership Guide to Business Agility”. This comprehensive guide focuses on embracing Agile principles to effect transformative change in organisations. An ardent advocate for continuous improvement and innovation, Giles is unwaveringly dedicated to creating a business world that prioritises value, inclusivity, and societal advancement.
Linkedin — https://www.linkedin.com/in/gileslindsay/